Before you read further, if you haven’t already, please read the Dummies Guide to Epidemiology (here) and be sure you understand the three key elements –
Basic Reproduction Number, herd immunity, and the SIR Model.
There are two very different versions or scenarios of the Chinese story. The mainstream version is that they were stupidly slow to wake up to events, but when they did, they introduced an amazingly strict lockdown which eventually solved the problem. The alternative version, put forward by Dr Wittkowski and others, is that China was already reaching herd immunity by the time they reacted, so all they really did was to interfere with the tail end of the natural curve. This caused a delay in reaching full herd immunity, and in this second scenario they are probably still not quite there.
With some knowledge of Epidemiology and the data available now, we should be able to review these scenarios, and see what actually makes sense. I’m quite excited by this, since I’m doing it as I write. First, lets take a look at the daily cases graph as shown on worldometer.info on 23rd April.
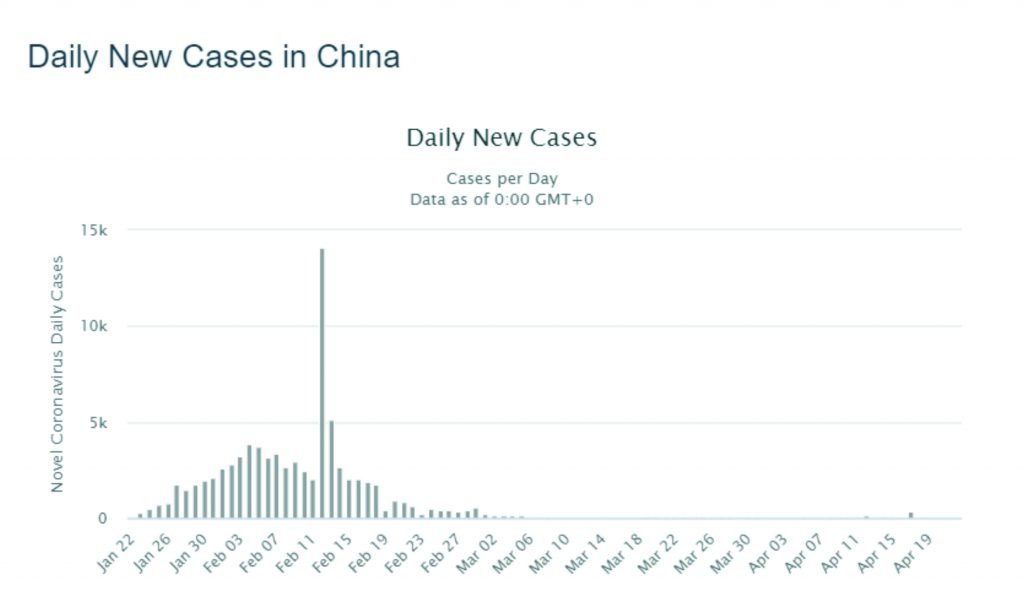
There are some obvious outliers on the statistics presented here, notably on 12th and 13th February, where they picked up a lot of cases they hadn’t entered previously. And also, there’s a tiny blip on 17th April, where again they’ve added a few hundred cases that they previously missed. When you correct for those two anomalies, you see a nice curve running from about 22nd January to 2nd March, with a peak around 8th February. Since about 3rd March there have only been a handful of cases each day, which in a country of 1.3 billion people is effectively nothing. Even though there are lighter lockdown measures still going on, this is an extremely strong indication that herd immunity, or something close to it, has been achieved. If we compare to Sweden, which also currently has a light lockdown in place, there are about 400 new cases per day there in a population of only ten million. China’s population is about 130 times larger than Sweden’s, so an equivalent daily figure for China would be over 50,000. Yet even when the epidemic was at it’s peak, according to the graph, China never had more than 5,000 cases per day. These figures simply do not fit with each other, indicating very strongly that China is indeed close to herd immunity.
We can look at it a different way. China has, to date, 83,000 confirmed cases. According to the Santa Clara study by Stanford University, actual cases were 50 to 85 times the confirmed number. So on the basis of that, we might generously conclude that actual Chinese cases have been 100 times the 83,000, or 8,300,000. That is a drop in the ocean compared to the number China would need for herd immunity. Even if we go up another order of magnitude to 83,000,000, that is still only about 7% of the population. That would have only a marginal effect on the increase of infections.
It seems we have to conclude that China is close to herd immunity, but this immunity cannot have been brought about by the numbers shown on the graph, and therefore cannot be explained by the first scenario.
The second scenario is that the epidemic was nearing its natural close when China stepped in with its lockdown. This does make sense for several reasons. First, the peak on the graph is hardly a peak at all; certainly nowhere near the sharp peak expected from a virus with an R0 of at least 2.2 in a totally susceptible population. The flat curve could potentially be explained by cases increasing as medics became more aware of the virus, then declining at the very end of the natural epidemic curve. In this scenario the confirmed cases would only be a small fraction of all those that had taken place prior to 23rd January. Also, the rise in cases should have begun some two months earlier, which would be 23rd November. There is evidence of the first case in China actually being on 17th November, and questions about the epidemic having started somewhat earlier than that, so this fits very well.
It is therefore reasonable to conclude that by the end of the apparent peak on the graph, the number of cases that would have been confirmed (had medics known what they were looking at) is much higher than the currently stated number. I would need a little input from a mathematician here, but might hazard a guess at 40 times higher. That would give a different confirmed case figure of 83,000 times 40, or 3.3 million. If we multiply that by 100 as we did in the first scenario, we get 330 million actual cases. For herd immunity to a virus with an R0 of 2.2 we need about 55% of people to be resistant. For China that is 700 million, so perhaps only 650 million if they are not quite at full immunity. If we double the 330 million we get to that number! This scenario is therefore perfectly possible as the numbers are in the right ball park, or right order of magnitude if you prefer maths speak. The first scenario is not possible, because even when we increased the number by a further ten times, the number of people resistant was still only a fraction of the number required for immunity.
The conclusion here is that the only scenario that accounts for the Chinese numbers is the one put forward by Dr Wittkowski and others. Namely that herd immunity was almost reached by the time of the Chinese lockdown, and that the lockdown merely interfered with the final run to full immunity.
A question remains about the Chinese need for brand new mega-hospitals even at the end of the epidemic curve. There must have been very many more deaths prior to them being built. This is perhaps where the Chinese do deserve criticism. Perhaps they thought they were just having a bad flu year, and didn’t pay sufficient care or attention. Or perhaps the mega-hospitals were built, but remained largely empty, as the 4,000 bed Nightingale Hospital in London has (See FT report here.)
The final takeaway from all this is that the Chinese lockdown, constantly hyped as a Silver Bullet against the Coronavirus, was no such thing. It did them little good, and their experience gives absolutely no reason for us to copy them.